|
|
You are here: Foswiki>ALE Web>GamasonicBatteryTesting (02 February 2026, CharlesShapiro)Edit Attach
Gamasonic Battery Testing
The Question of the Moment
In the NE corner of the EShop under the right side of the soldering station you will find a cardboard box filled with around a thousand Gamasonic solar powered flashlights, all of them non-functional. The only broken thing on these is the switch. The three batteries, two LEDs, and nice glass solar cell all work just fine. You can dissect the working parts out easily with a J000 screwdriver, then unsolder the push button switch to get a nifty little solar cell + battery power source that has all kinds of interesting uses. They'll charge up all the way to a little under 4.2V in full sun in about 2 hours. Replace the push button with a toggle, and the flashlight will light up a camping tent for at least a couple of hours. Gang several together on the same switch for more light. Or solder some blinkies in place of the white LEDs and make yourself a bike light that'll go for a couple of hours. All very cool, but for more interesting uses, such as powering a node in a sensor network or running a tiny microprocessor, you will need to understand how much power this little gizmo pumps out for how long. Then you can decide whether it's practical to use just one of these things, or if you'll need to gang them together somehow.Answering the Question of the Moment
In order to find the power curve on a battery, you need to put it under load for a while and measure its output voltage at intervals. I am Way Too Stupid to do this by hand, so I hax04ed together a little Arduino-powered machine to do it for me. The voltage at full charge on these bad boys is around 4.1 volts, so I can connect them directly to an analog pin on the board and just measure the voltage from there. I used an Arduino Uno for this; smaller or larger boards would probly work, but that was what I had. I removed the LEDs from a Gamasonic board and soldered breadboard pin connectors to the + and - leads at the end of the board. I also printed a little strain relief and bolted it on; without this, the wires break almost instantly. I soldered wires to all four LED pads on the board. I believe that the LEDs are wired in parallel. If you short one pair of LED pads together the other LED won't light, but if you leave them open it will. So I only connected one + and one - lead from the battery board to my Arduino.Recording Data
I used a Seeed Studio SD card shield, a green LED on pin 4 so I could see what was happening, and a switch on pin 7 so I could exert some crude control of the process. I used a couple of 5mm white LEDs for the load on the Gamasonic board; resistors would probly have worked as well, but would make it harder to see that it was workin'. All plugged in it looked this: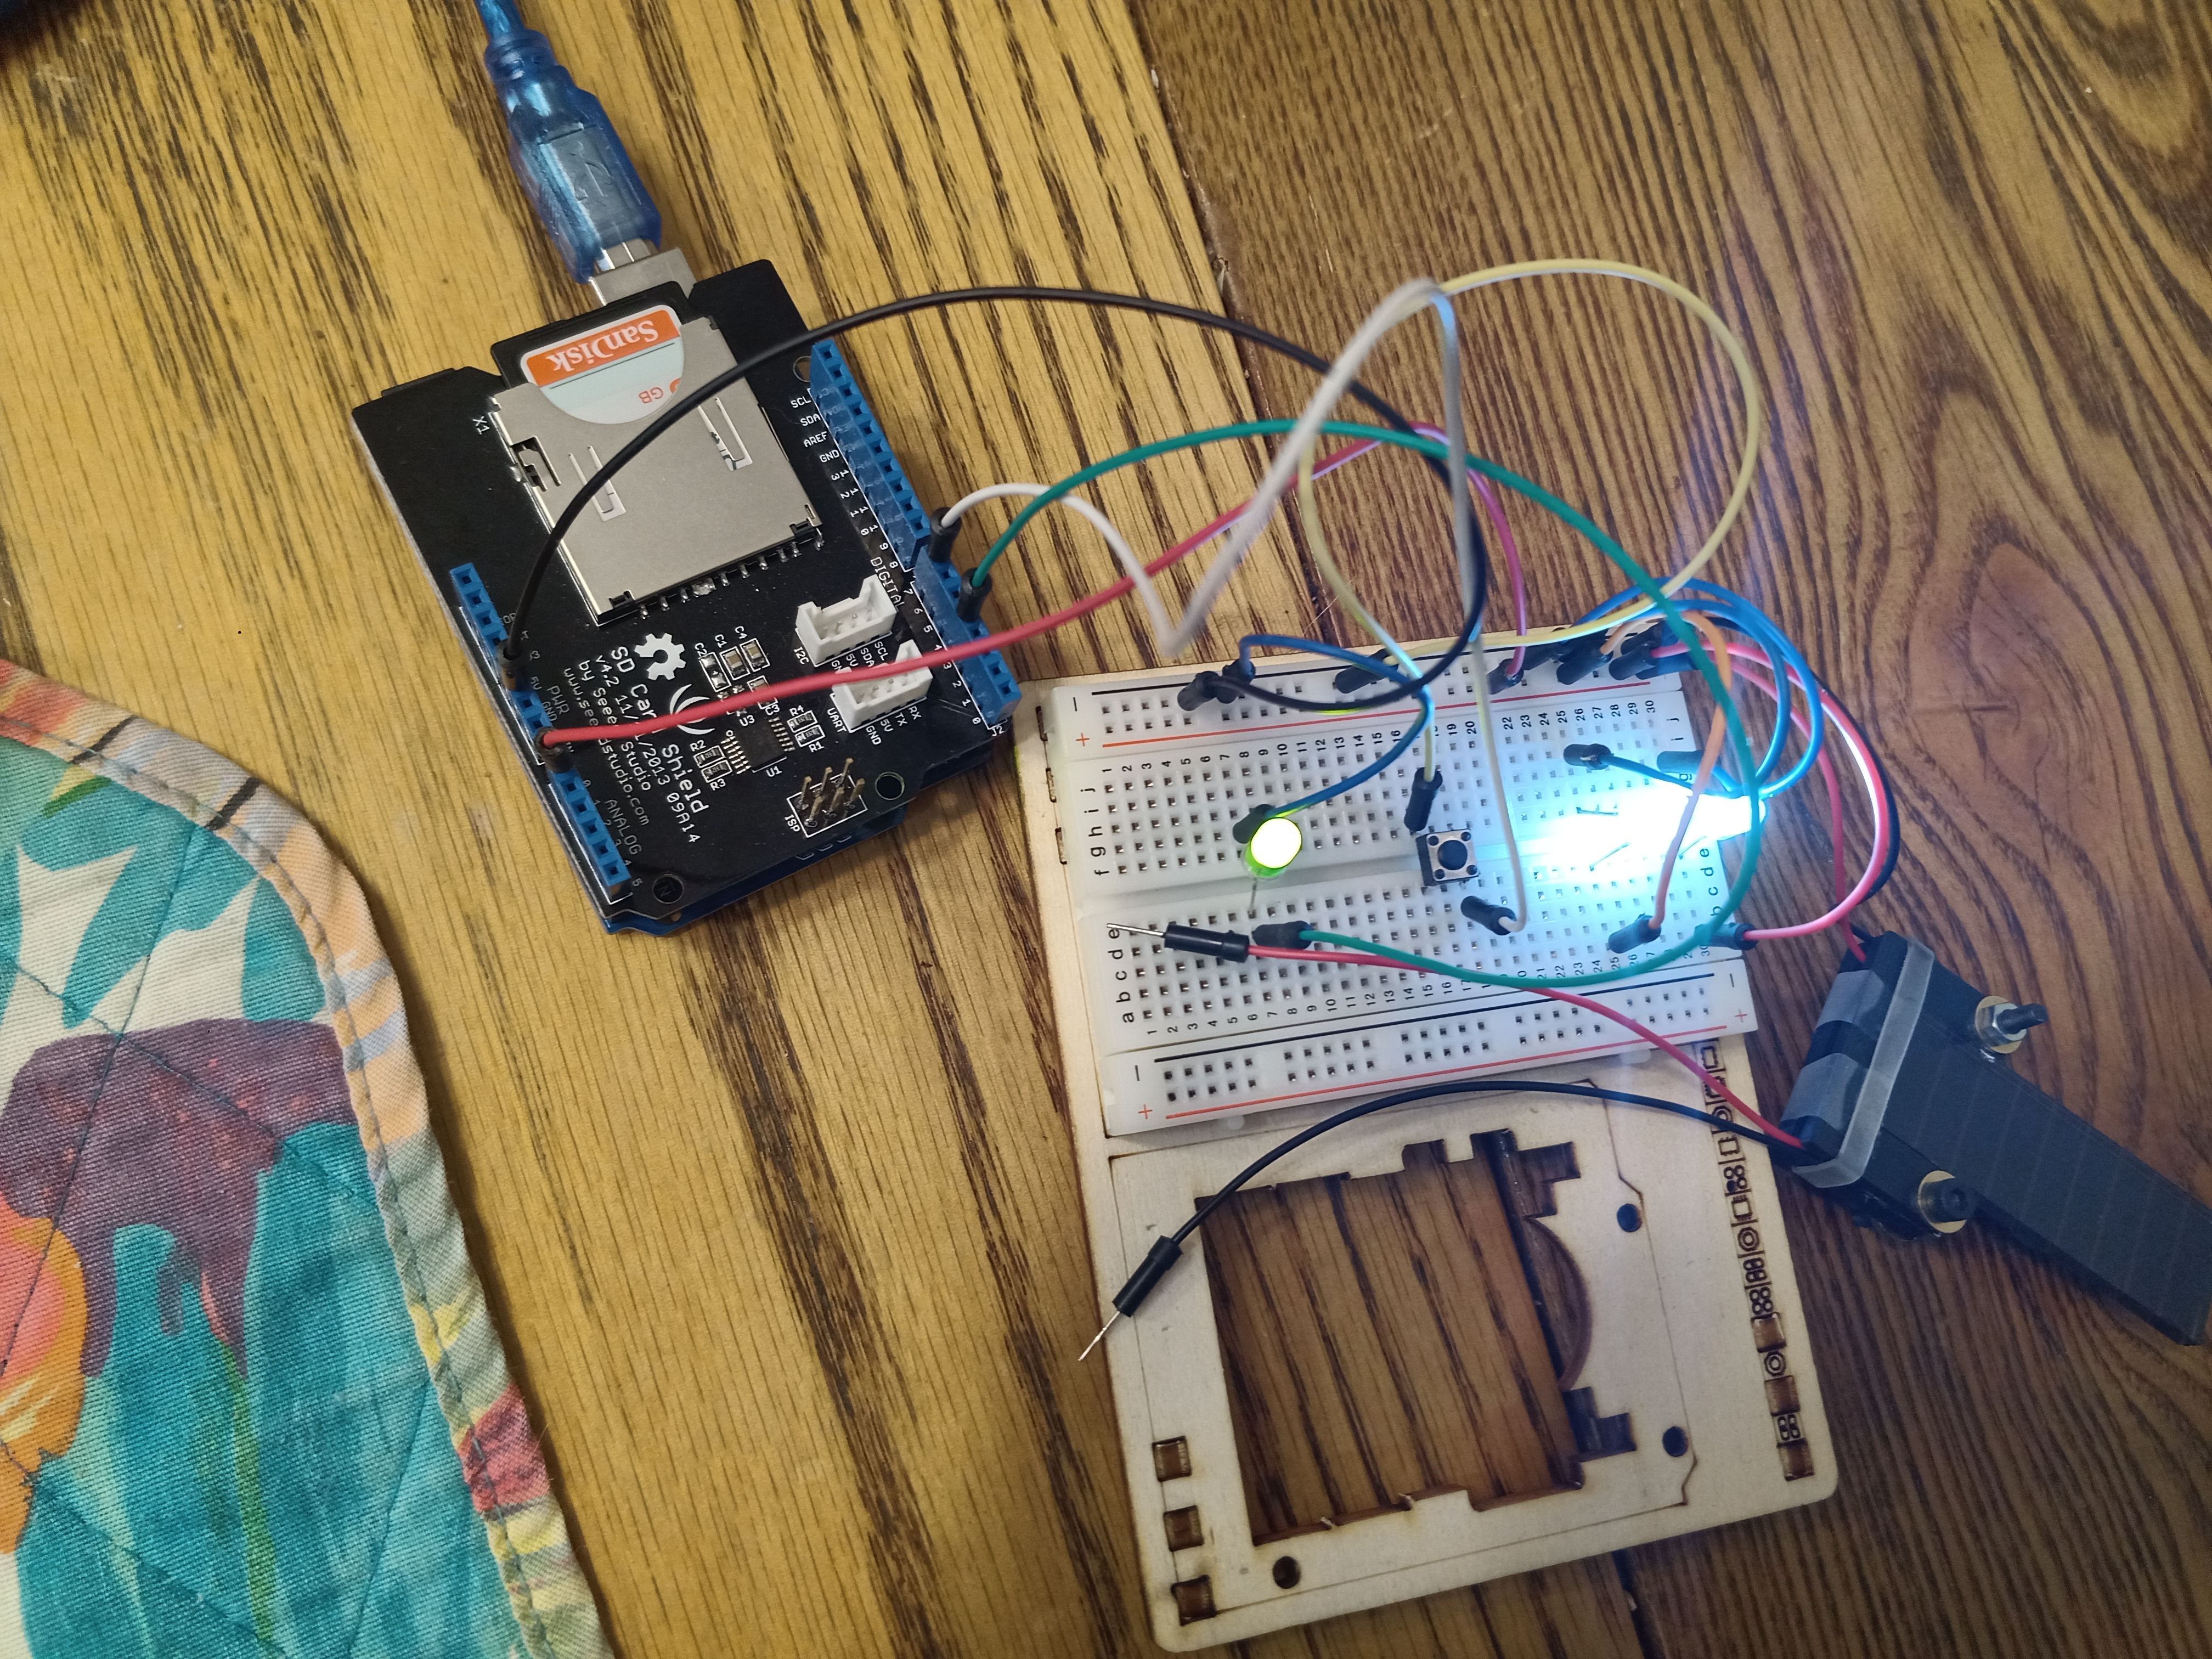 I have attached a Circuit_Diagram.
The arduino is
programmed to
gather a voltage and a crude timestamp every five seconds. Every 10
voltage reads, it writes the data it collected to a CSV file on the
SD card. Press the button and it stops collecting data,
saves whatever data it has to the card, and turns off the LED. Press the
button again and it turns the green LED back on and restarts gathering data, eventually
writing the new data to a new file. The battery keeps discharging through the load regardless of the state of the Arduino. If the battery voltage goes below
0.1V, it turns the green LED off but keeps gathering battery data. That way I can see when it stops being worthwhile to continue.
I have attached a Circuit_Diagram.
The arduino is
programmed to
gather a voltage and a crude timestamp every five seconds. Every 10
voltage reads, it writes the data it collected to a CSV file on the
SD card. Press the button and it stops collecting data,
saves whatever data it has to the card, and turns off the LED. Press the
button again and it turns the green LED back on and restarts gathering data, eventually
writing the new data to a new file. The battery keeps discharging through the load regardless of the state of the Arduino. If the battery voltage goes below
0.1V, it turns the green LED off but keeps gathering battery data. That way I can see when it stops being worthwhile to continue.
What I Found
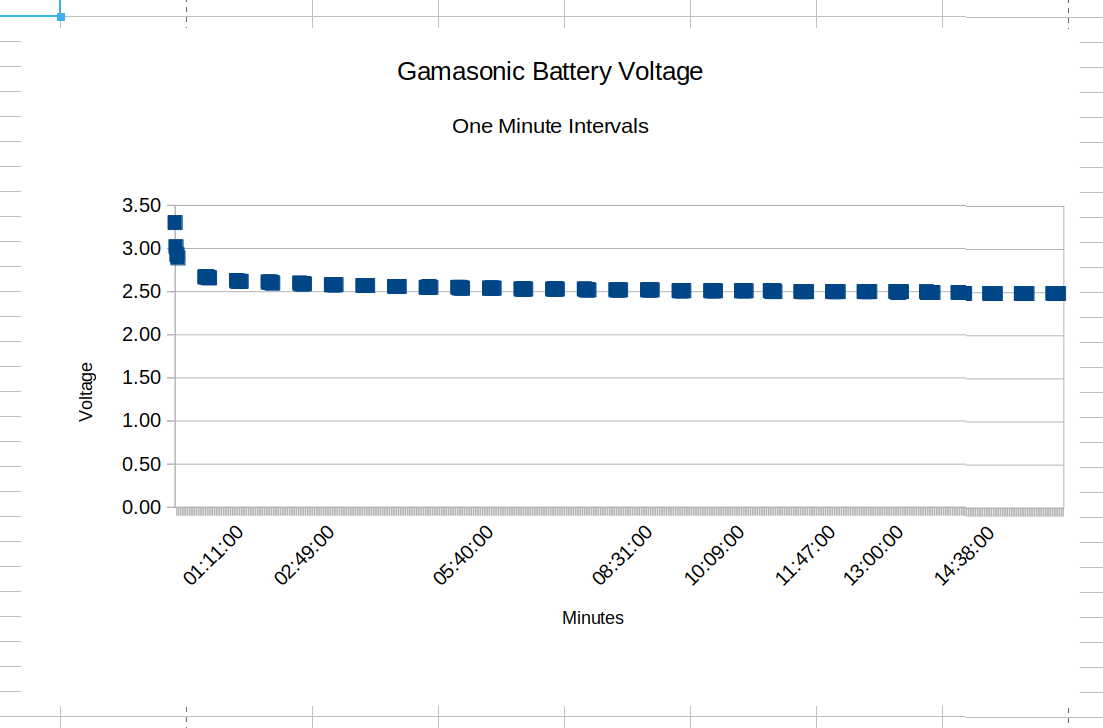
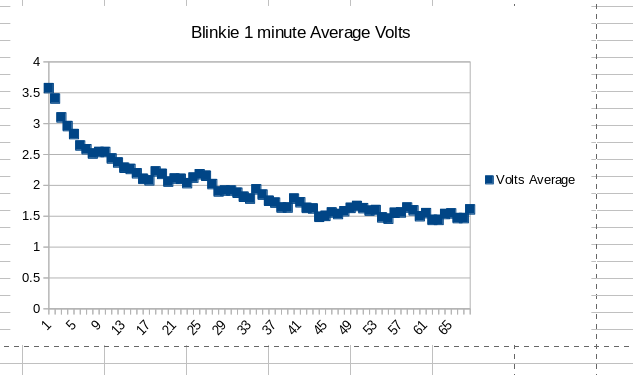
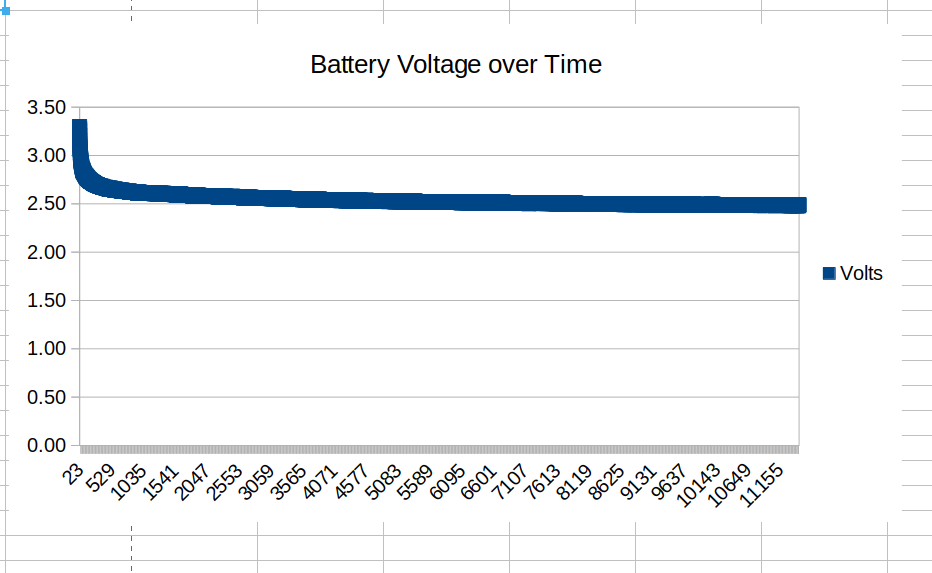
I ran this test setup for a little under 16 hours. You can see the graph I got at the top of this page. Raw data is attached . I bunged it all into a spreadsheet to produce that graph. My spreadsheet-fu is only moderate, but what the data actually showed was voltage dropping pretty quickly over about an hour, then leveling off right at 2.5V over the rest of the run. The LEDs are bright for the first hour or so, then dim to a faint glow for the rest of the test. I ran it again with blinkie light LEDs, which demand more power. This went for about an hour, at which point the LEDs were completely dark. You can see my results in the second chart. I averaged 12 readings over the course of a minute for this chart, because the blinkies demand variable amounts of power depending on where they are in their blink cycle. --30--

| I | Attachment | Action | Size | Date | Who | Comment |
|---|---|---|---|---|---|---|
| |
GamasonicTest.ino | manage | 4 K | 28 January 2026 | CharlesShapiro | Arduino Code |
| |
BTEST.ods | manage | 100 K | 29 January 2026 | CharlesShapiro | Battery Data Spreadsheet |
| |
Circuit_Diagram.svg | manage | 141 K | 28 January 2026 | CharlesShapiro | Battery machine circuit diagram |
| |
VoltageGraphOneMinute.png | manage | 40 K | 29 January 2026 | CharlesShapiro | Battery Voltage at One Minute Intervals |
| |
BTEST_BLINKIE.ods | manage | 52 K | 02 February 2026 | CharlesShapiro | Chart Spreadsheet of blinkie load |
| |
btest_blinkie.png | manage | 19 K | 02 February 2026 | CharlesShapiro | Gamasonic Battery with Blinkie Load |
| |
Arduino_overhead.jpg | manage | 4 MB | 28 January 2026 | CharlesShapiro | Overhead view of battery machine |
| |
BTEST.CSV | manage | 167 K | 28 January 2026 | CharlesShapiro | Raw Battery Data |
| |
BTEST_BLINKIE.csv | manage | 11 K | 02 February 2026 | CharlesShapiro | Raw data of battery test with blinkies |
| |
VoltageGraph.png | manage | 32 K | 28 January 2026 | CharlesShapiro | Voltage over Samples |
Edit | Attach | Print version | History: r3 < r2 < r1 | Backlinks | View wiki text | Edit wiki text | More topic actions
Topic revision: r3 - 02 February 2026, CharlesShapiro
Ideas, requests, problems regarding Foswiki? Send feedback